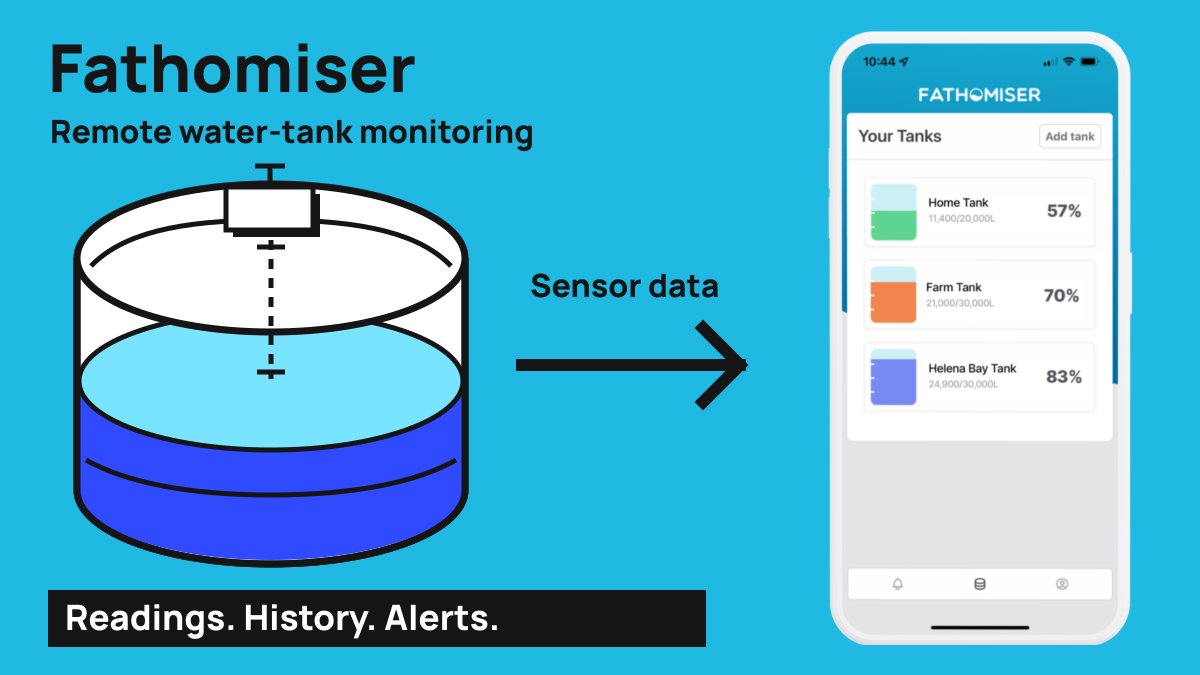
Fathomiser: Turning Sensor Readings into Useful Water Levels
Fathomiser was a family venture built around a very practical question: how much water is left in a tank when you are somewhere else? Our own experience with dry summers in rural Northland was part of the reason for building it.
I was one of its founders and worked on the software connecting a cellular monitoring device to a web and mobile dashboard. That covered backend services, tank readings, settings, charts and notifications. The project involved other people across product development, electronics, firmware and the business, too.
The interesting software problem was the distance between what the device measured and what someone wanted to know. A sensor could send a distance, a timestamp and a battery voltage. A tank owner needed a water level, a useful history, and some indication of whether that information was still current.
Start with what the device actually sent
The device sent a binary packet. Unlike a JSON object, it did not label each value with a property name. The backend needed to know where the fields lived and how to interpret their bytes.
The packet carried a device identifier, a sequence number, a time value, distance in millimetres, battery voltage and accelerometer readings. The decoder checked the expected packet header and event type before interpreting the measurement fields. Battery voltage also needed conversion from its encoded unit into volts.
These details are easy to hide behind a nicely typed application object. They still determine whether the numbers in that object mean anything. A TypeScript field called timestamp describes a name and type; it does not establish the device's time convention.
One of my changes in March 2022 is a good example. The backend had been treating the device's time value as Unix seconds, multiplying it by 1,000 and passing it to JavaScript's Date constructor. The device encoding instead represented calendar components: year, month, day, hour, minute and second.
I replaced that conversion with a dedicated decoder. It separated those components, applied the month and day offsets, and constructed a UTC date. The integer needed interpreting according to the device protocol before it could become an ordinary application timestamp.
The fix was small, but the boundary matters. The timestamp follows a reading into storage, charts and comparisons with earlier readings. Getting a JavaScript Date object out of a number is not enough; it needs to represent the time the device meant.
A distance is not a water level
The measurement was a distance from the sensor towards the water surface. Turning it into an estimated volume required information about the tank and installation.
The backend used the configured tank height, capacity and overflow offset. It converted the tank dimensions into the same unit as the sensor distance, accounted for the offset, then calculated the proportion of the tank occupied by water. Multiplying that proportion by capacity gave the estimated volume in litres. The result was bounded between zero and the configured capacity.
That proportional calculation has assumptions. It uses the configured height and capacity to translate water height into volume; it is not a model of every possible tank shape. The settings therefore belong to the measurement path, even though they appear in a different part of the interface.
This is why a monitoring dashboard needs more than a chart component. A number displayed as litres depends on the device reading, unit conversion and tank configuration all agreeing about what they mean.
Make the installation visible
A physical sensor can also be installed at an angle or knocked out of position. The packet's accelerometer readings gave the software another signal to work with.
The ingestion path checked the device's orientation and could send an installation warning asking the owner to check whether it was pointing down correctly. The earlier backend also stopped processing a reading when that orientation check failed. The later shared implementation retained the warning alongside its reading and notification flow.
I like this part of the project because it connects software to something the person can actually do. A chart cannot straighten a device. A warning that describes the installation problem can direct someone towards checking it.
Turn readings into a useful history
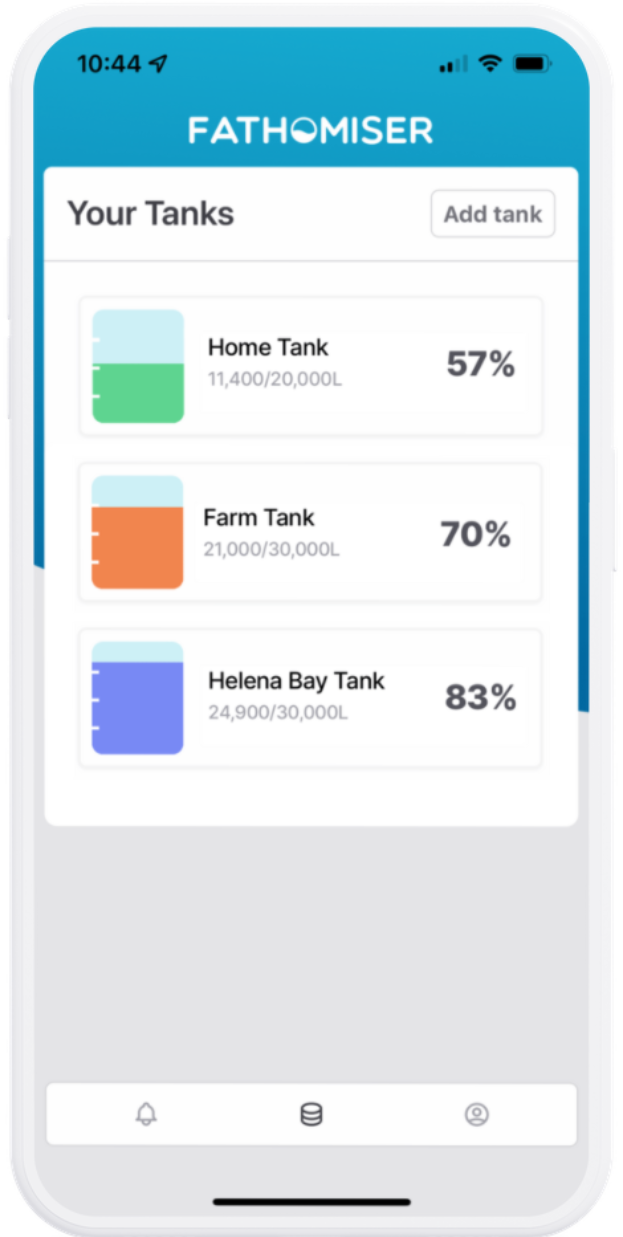
The stored readings supported the dashboard's current volume and history. The overview also included recent change, average daily usage, an estimated number of days remaining, last activity and battery voltage.
I worked on the tank overview in 2022. Its calculation grouped readings by day, ordered them, and used the final reading from each day to calculate changes. The days-remaining estimate divided the current volume by average daily usage.
That is a simple estimate, and it should be understood as one. A recent refill or a different consumption pattern can change what a short history tells you about the future. The history gives the owner context for the estimate, while the last-active time gives context for the history itself.
The dashboard was built with React and TypeScript. Later work used Capacitor to connect the web interface to iOS and Android projects. My changes included tank settings, reading data, mobile layouts and a notification-rule editor, extending the same product across browser and mobile interfaces.
Alerts need readings and silence
Notification rules gave the owner a way to describe changes they cared about over a chosen period. The later backend compared a new reading with an earlier reading, related the difference to tank capacity, and checked it against the rule. The frontend exposed the period and threshold through an editor rather than expecting someone to understand the storage model.
The system also checked for tanks that had stopped reporting. That required a separate path: receiving a measurement could trigger a level check, but a missing measurement would never invoke that handler.
The offline detector compared the most recent reading with the tank's configured check-in interval. Its threshold allowed twice that interval before identifying the tank as offline. It also recorded notification recipients temporarily to limit repeated warnings.
A no-data alert answers a different question from a low-water alert. The first says the system has stopped hearing from the device. It cannot establish the water level. Keeping those meanings separate is part of making remote monitoring understandable.
A connected product is a chain of interpretations
Fathomiser brought together a device, AWS services, stored readings, browser and mobile interfaces, and notifications. I continued working on its software through later iterations, including the consolidated services and dashboard.
The timestamp correction is the most compact example of the work. A raw value crossed a boundary where its meaning needed to become explicit. The same was true of millimetres becoming litres, daily readings becoming an estimate, and an absent reading becoming a warning.
That is what made the project interesting to build: following a measurement far enough that it could help someone understand their tank, including the limits of what the software knew.
Explore the Fathomiser project, or see my broader work history.