SoftwareCOL
Compare software-engineer pay, taxes, and living costs across 25 city hubs.
SoftwareCOL is an interactive atlas for exploring what software-engineer compensation might leave after taxes and living costs. Compare 25 city hubs, choose a career stage and household, and inspect how housing, healthcare, childcare, shopping, and transport affect the modelled annual surplus.
A map, ranked city list, and head-to-head ledger offer different ways into the same scenario. Change the display currency or customise driving distance, basket size, and a remote salary. The comparisons depend on the app’s compensation, tax, exchange-rate, and cost assumptions; they are estimates for exploration.
Highlights
- Compare 25 hubs on a map and in city ledgers
- Adjust career, household, housing, and transport
- Inspect taxes and costs behind the estimated surplus
In action
Follow the salary through the costs
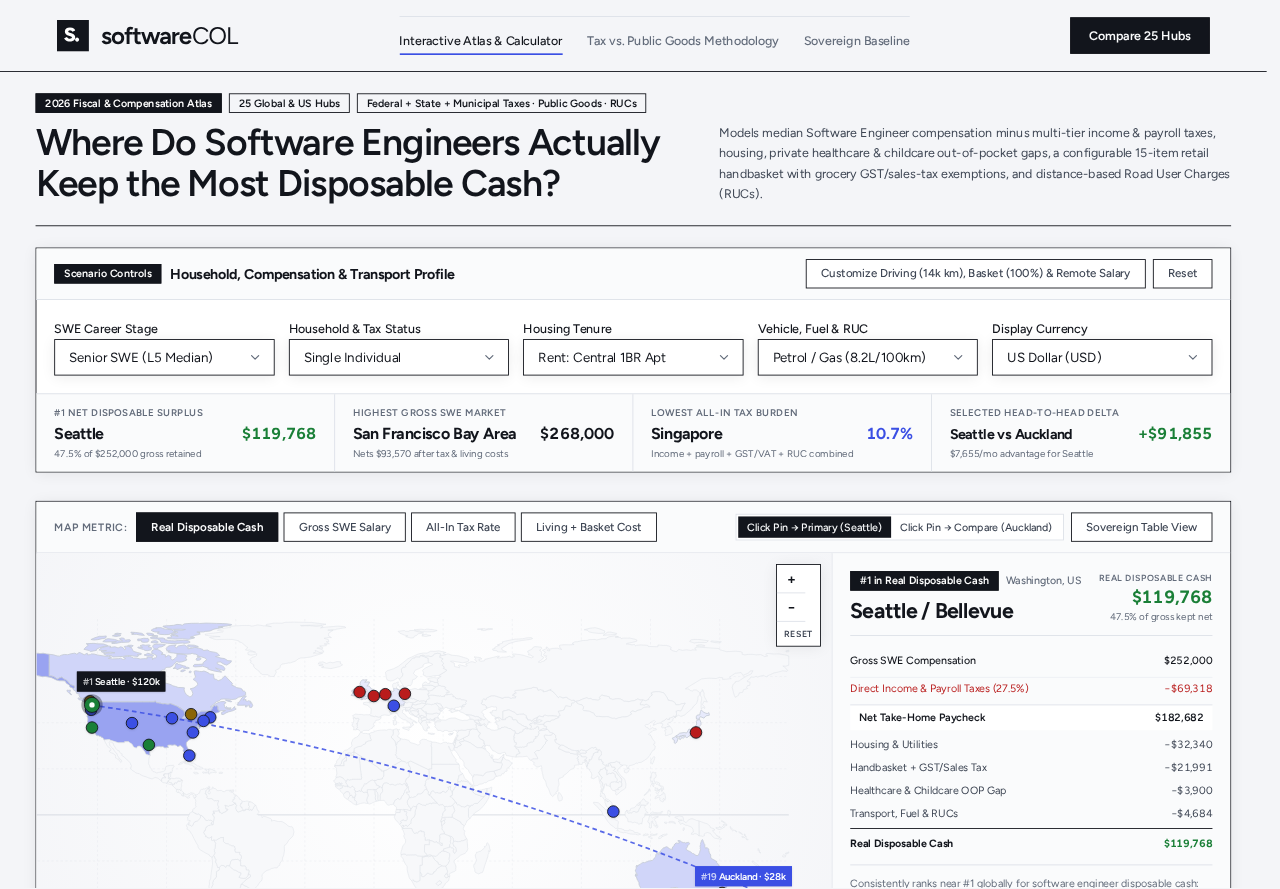
A salary figure is only the start of comparing places to work. SoftwareCOL brings compensation, income and payroll taxes, housing, household purchases, healthcare, childcare, and transport into one scenario. The remaining annual amount is the model’s disposable surplus.
Career stage, household, housing tenure, and vehicle choices change the comparison. Additional controls allow a remote salary, driving distance, and basket size to be explored. The purpose is to make the effect of those assumptions inspectable.
Move from the map to the ledger
The atlas covers 25 city hubs. Switch the map between disposable cash, gross salary, all-in tax rate, and living costs, then choose a primary city and a comparison city. A ranked list and table provide another route through the locations.
The head-to-head view itemises where the model allocates gross compensation. Taxes, housing, shopping, healthcare, childcare, and transport are shown alongside the remaining surplus. Changing the display currency keeps the two places comparable within the same view.
Keep the scenario beside the conclusion
The methodology view explains the categories used in the comparison, including layers of income tax, employee contributions, public services and private costs, consumption taxes, and road charges. A separate baseline view summarises the tracked hubs by country.
The outputs depend on the model’s data and assumptions about compensation, exchange rates, taxes, and household costs. They are useful for exploring scenarios, with the city ledgers showing what contributes to each result. A visitor’s actual offer and expenses can differ from the baseline.