Cursor Model ROI
Retired in October 2026. I have shut down the hosted dashboard. Automated fetching was still running, but the normalized pricing and benchmark data were no longer reliable enough to maintain a useful comparison. This article remains as a record of the project, not a current model recommendation.
Cursor exposes a growing matrix of models: frontier names, mid-tier workhorses, fast cheap options, and vendor-specific cache pricing that only shows up once you read the footnotes. The official table is accurate, but it is not optimized for the question I keep asking: if I am going to burn tokens on this repo today, which default actually makes sense?
List price per million tokens is a start, but it is not the whole picture. Some models are expensive on paper and cheap in practice because your prompt stack hits cache reads. Others look affordable until you notice output pricing or Max Mode multipliers. Arena-style benchmarks are an imperfect proxy for coding quality, yet they are still a useful sanity check when two models look similar on price.
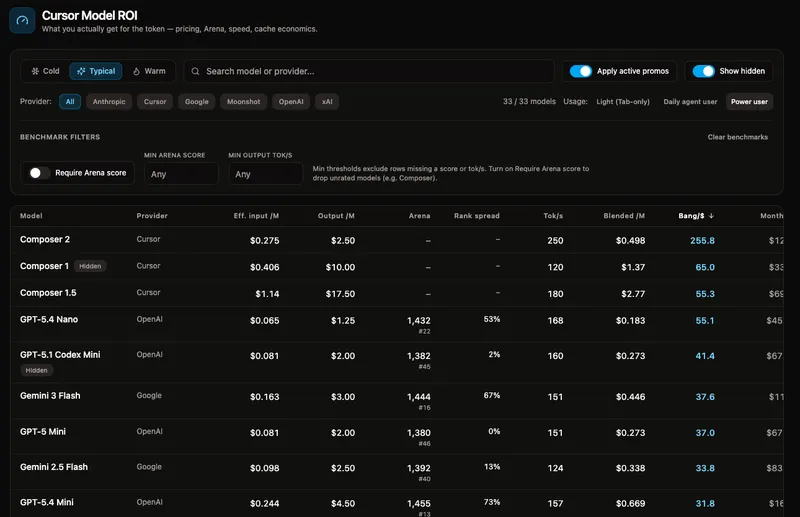
Cursor Model ROI was a small React app that put those dimensions beside each other in one sortable grid so you could compare without juggling three browser tabs. It combined pricing, available arena signals, speed tiers, and cache economics.
What you see in the UI
The main surface is a comparison table. Each row is a Cursor-supported model bundle: published input and output rates, optional cache write and read lines, and joined metadata from other JSON snapshots the refresh job maintains. You can sort by the columns that matter for your question: sometimes that is raw output price, sometimes it is a derived score that folds cache in, sometimes it is "how fast does Cursor classify this thing."
Opening a row launches a detail drawer with the full breakdown and notes pulled from the underlying export (promotions, context window limits, doc caveats). Above the table, filters trim the list when you only care about a provider or a price band. None of this replaces reading your own traces, but it does replace guessing from memory when someone asks "why are we still defaulting to X?"
Illustrative output price (USD per 1M output tokens)
This archived chart uses illustrative figures from the original project; it is not a current price comparison. It shows why a single number is misleading: the spread between a budget routing model and a flagship is an order of magnitude on output alone. The dashboard added arena and speed context on top so the comparison was less one-dimensional than bars alone.
Where the data comes from
The app did not scrape private usage from your machine. It shipped with JSON snapshots produced by a refresh script in the same package: Cursor's published model page, plus auxiliary sources for arena rankings, speed labels, cache provider facts, and promotions. A GitHub Actions workflow fetched source data on a schedule. Fetching raw pages did not automatically keep the normalized model data correct; those snapshots still needed manual review. The refresh workflow has now been disabled.
The original UI included a methodology panel and freshness information. In practice, a recent fetch timestamp could coexist with old normalized prices or missing benchmark scores. That maintenance gap is why I retired the dashboard.
Stack and shipping
The original app used the same deployment pattern as the other reb.nz tools: Vite, TypeScript, Tailwind, and AWS Amplify wired up with Pulumi in the monorepo. It had minimal analytics and no account system because it only displayed public rate cards.
The project was useful for exploring how pricing, cache behavior, benchmark signals, and speed interact. Keeping that comparison trustworthy required more ongoing data review than I could justify.
The former cursor-roi.reb.nz deployment is retired. The screenshots and implementation discussion above document what I built.